Are you looking to achieve profitable trading results? If so, then the Moving Average Crossover Indicator is a powerful tool that can help you make informed trading decisions. In this article, we will explore the ins and outs of this indicator and how it can be used to enhance your trading strategies.
What is the Moving Average Crossover Indicator?
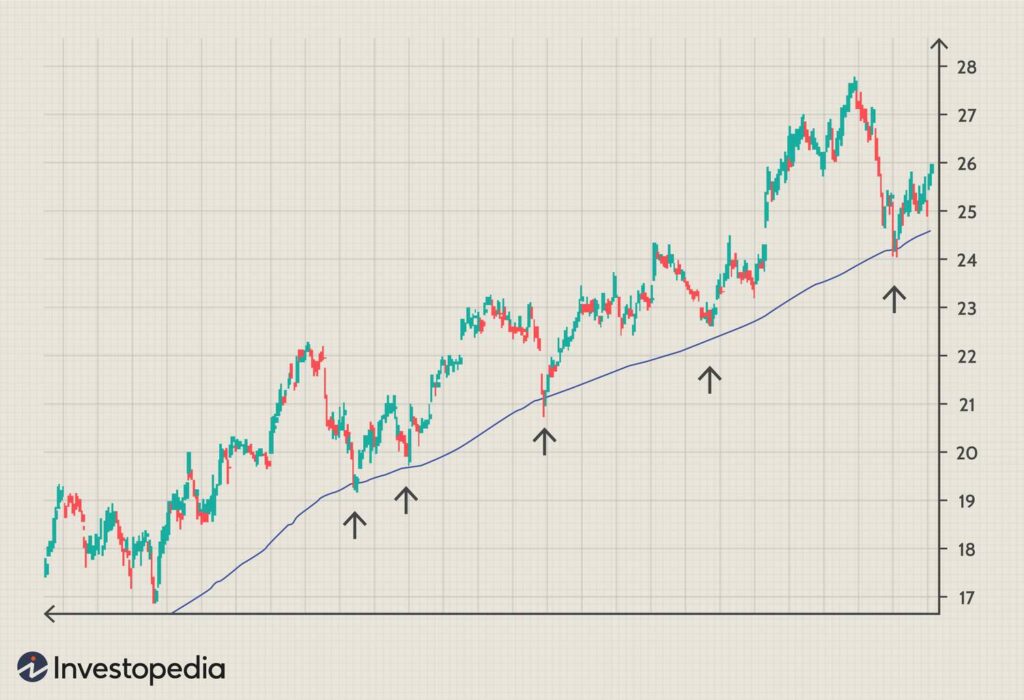
The Moving Average Crossover Indicator is a technical tool used by traders to identify potential changes in market trends. It analyzes two or more moving averages, which are calculated by adding the closing prices of a security over a specific period of time and dividing it by the number of periods. By comparing different moving averages, traders can spot potential buy or sell signals.
How does the Moving Average Crossover Indicator work?
The Moving Average Crossover Indicator works by comparing two moving averages: a shorter-term moving average and a longer-term moving average. When the shorter-term moving average crosses above the longer-term moving average, it generates a bullish signal, indicating a potential uptrend. On the other hand, when the shorter-term moving average crosses below the longer-term moving average, it generates a bearish signal, indicating a potential downtrend.

Credit: www.forexcracked.com
:max_bytes(150000):strip_icc()/MOVING-AVERAGE-FINAL-21674874615f49c19444bbd9d2086c51.jpg)
Credit: www.investopedia.com
Using the Moving Average Crossover Indicator for Profitable Trading
When it comes to using the Moving Average Crossover Indicator, one effective strategy is to combine it with other technical indicators, such as the Moving Average Convergence Divergence (MACD). The MACD helps in confirming bullish or bearish signals, providing additional reliability to the Moving Average Crossover Indicator.
It is important to note that while the Moving Average Crossover Indicator is a powerful tool, it has its limitations. Since moving averages are lagging indicators, the crossover technique may not capture exact tops and bottoms. However, it can help you identify the bulk of a trend, allowing you to enter or exit trades at favorable price levels.
The Best Settings for the Moving Average Crossover Indicator
The settings for the Moving Average Crossover Indicator can vary depending on the time frame and market being traded. It is recommended to experiment with different settings and analyze historical price data to find the most effective combination of moving averages for your trading strategy.
The Benefits of the Moving Average Crossover Indicator
The Moving Average Crossover Indicator offers several benefits for traders:
- Identifies potential trend reversals
- Provides buy and sell signals
- Can be combined with other technical indicators for increased accuracy
- Helps identify entry and exit price levels
Frequently Asked Questions Of Moving Average Crossover Indicator : Boost Your Trading Success
What Is The Most Effective Moving Average Crossover?
The most effective moving average crossover is when combined with the MACD indicator for confirmed bullish or bearish signals. The Moving Average Convergence Divergence (MACD) helps identify market trends, determining ideal entry and exit levels.
What Moving Average Crossovers Can Be Used To Indicate?
Moving average crossovers indicate potential trends in markets to help with entry and exit points. Two common signals are the bullish crossover (short-term moving average rising above long-term) and bearish crossover (short-term moving average falling below long-term). These crossovers can signal uptrends or downtrends.
What Is The Best Setting For Ema Cross Indicator?
For the best EMA cross indicator setting, combine with MACD for confirmed signals. MACD helps determine market direction for ideal entries and exits.
How Do You Scan A Moving Average Crossover?
Scan a moving average crossover by setting the moving average (Exponential) filter. Choose the first moving average and “Close” to identify closing price crossovers. Select above (Bull signal) or below (Bear signal). Choose a second moving average or “Close” to complete the scan.
Conclusion
The Moving Average Crossover Indicator is a valuable tool that can greatly enhance your trading strategies. By understanding its mechanics and incorporating it into your technical analysis, you can identify potential trend reversals and make more informed trading decisions. Remember to backtest your strategy and adjust the settings to fit your trading style and market conditions.

